Ofqual built a model that graded schools, then handed the grades to students
England's 2020 exam algorithm downgraded 39.1% of A-level grades by fitting each student to their school's 2017-2019 record.
Why this matters
In the summer of 2020, England's exam regulator faced a problem no exam board had faced before: no exams. It built a statistical model to assign 700,000 students grades anyway, and the model worked exactly as designed. The system was not buggy, hacked, or misused. It took a correct, well-tested piece of statistics and asked it a question statistics cannot answer: what grade this particular student deserves. Students marched over the answer, and within four days a government reversed course. This lesson opens the model itself, the exact steps that turned a teacher's ranking into a calculated grade, and shows the same design choice at work in any system that scores a person by the record of the group it puts them in.
- 01
- The Dutch tax office turned a non-Dutch passport into a fraud score: a government algorithm that harmed citizens through a proxy, a different mechanism from this lesson's.
- 02
- Ofqual's interim report: the regulator's own account of the model, with its full worked procedure.
A model built to keep grades where they always were
In March 2020, the United Kingdom cancelled its summer exams to slow the spread of COVID-19. England's qualifications regulator, Ofqual, had to produce A-level and GCSE grades for roughly 700,000 students without a single exam sat. Teachers submitted two things for every student in every subject: a Centre Assessment Grade (CAG), their best estimate of the grade earned, and a rank order, placing every student from strongest to weakest.1
Left alone, teachers' estimates ran high. Awarded as submitted, Ofqual calculated, A-level grades at A* would have jumped from 7.7% in 2019 to 13.9%, and B or above from 51.1% to 65%.1 The Education Secretary, Gavin Williamson, had directed Ofqual to keep 2020's grade distribution close to previous years'.1 Ofqual answered with the Direct Centre Performance model, which adjusted each centre's submitted grades to match a distribution built from that centre's own results in 2017, 2018, and 2019, adjusted for this cohort's prior attainment.1
The result, published on results day, 13 August 2020: 58.7% of A-level grades matched the CAG exactly, 39.1% were adjusted down by at least one grade, and 2.2% were adjusted up.2 Ofqual had hit its target: national A grades and above rose 2.4 points over 2019, against a normal year's movement closer to one point.1 The inflation Williamson's direction was meant to prevent never appeared in the headline figures. What the figures did not show was that the 39.1% fell unevenly, on named students at named schools, and within days it was in the street.
Who the 39.1% actually was
Ofqual's own December 2020 breakdown, by centre type, shows who the downgrades fell on. Independent schools had the lowest downgrade rate of any centre type, 33.8% of their A-level CAGs adjusted down; further-education colleges had the highest, 45.6%. Comprehensives and academies, teaching most state-educated sixth-formers, sat in between.3
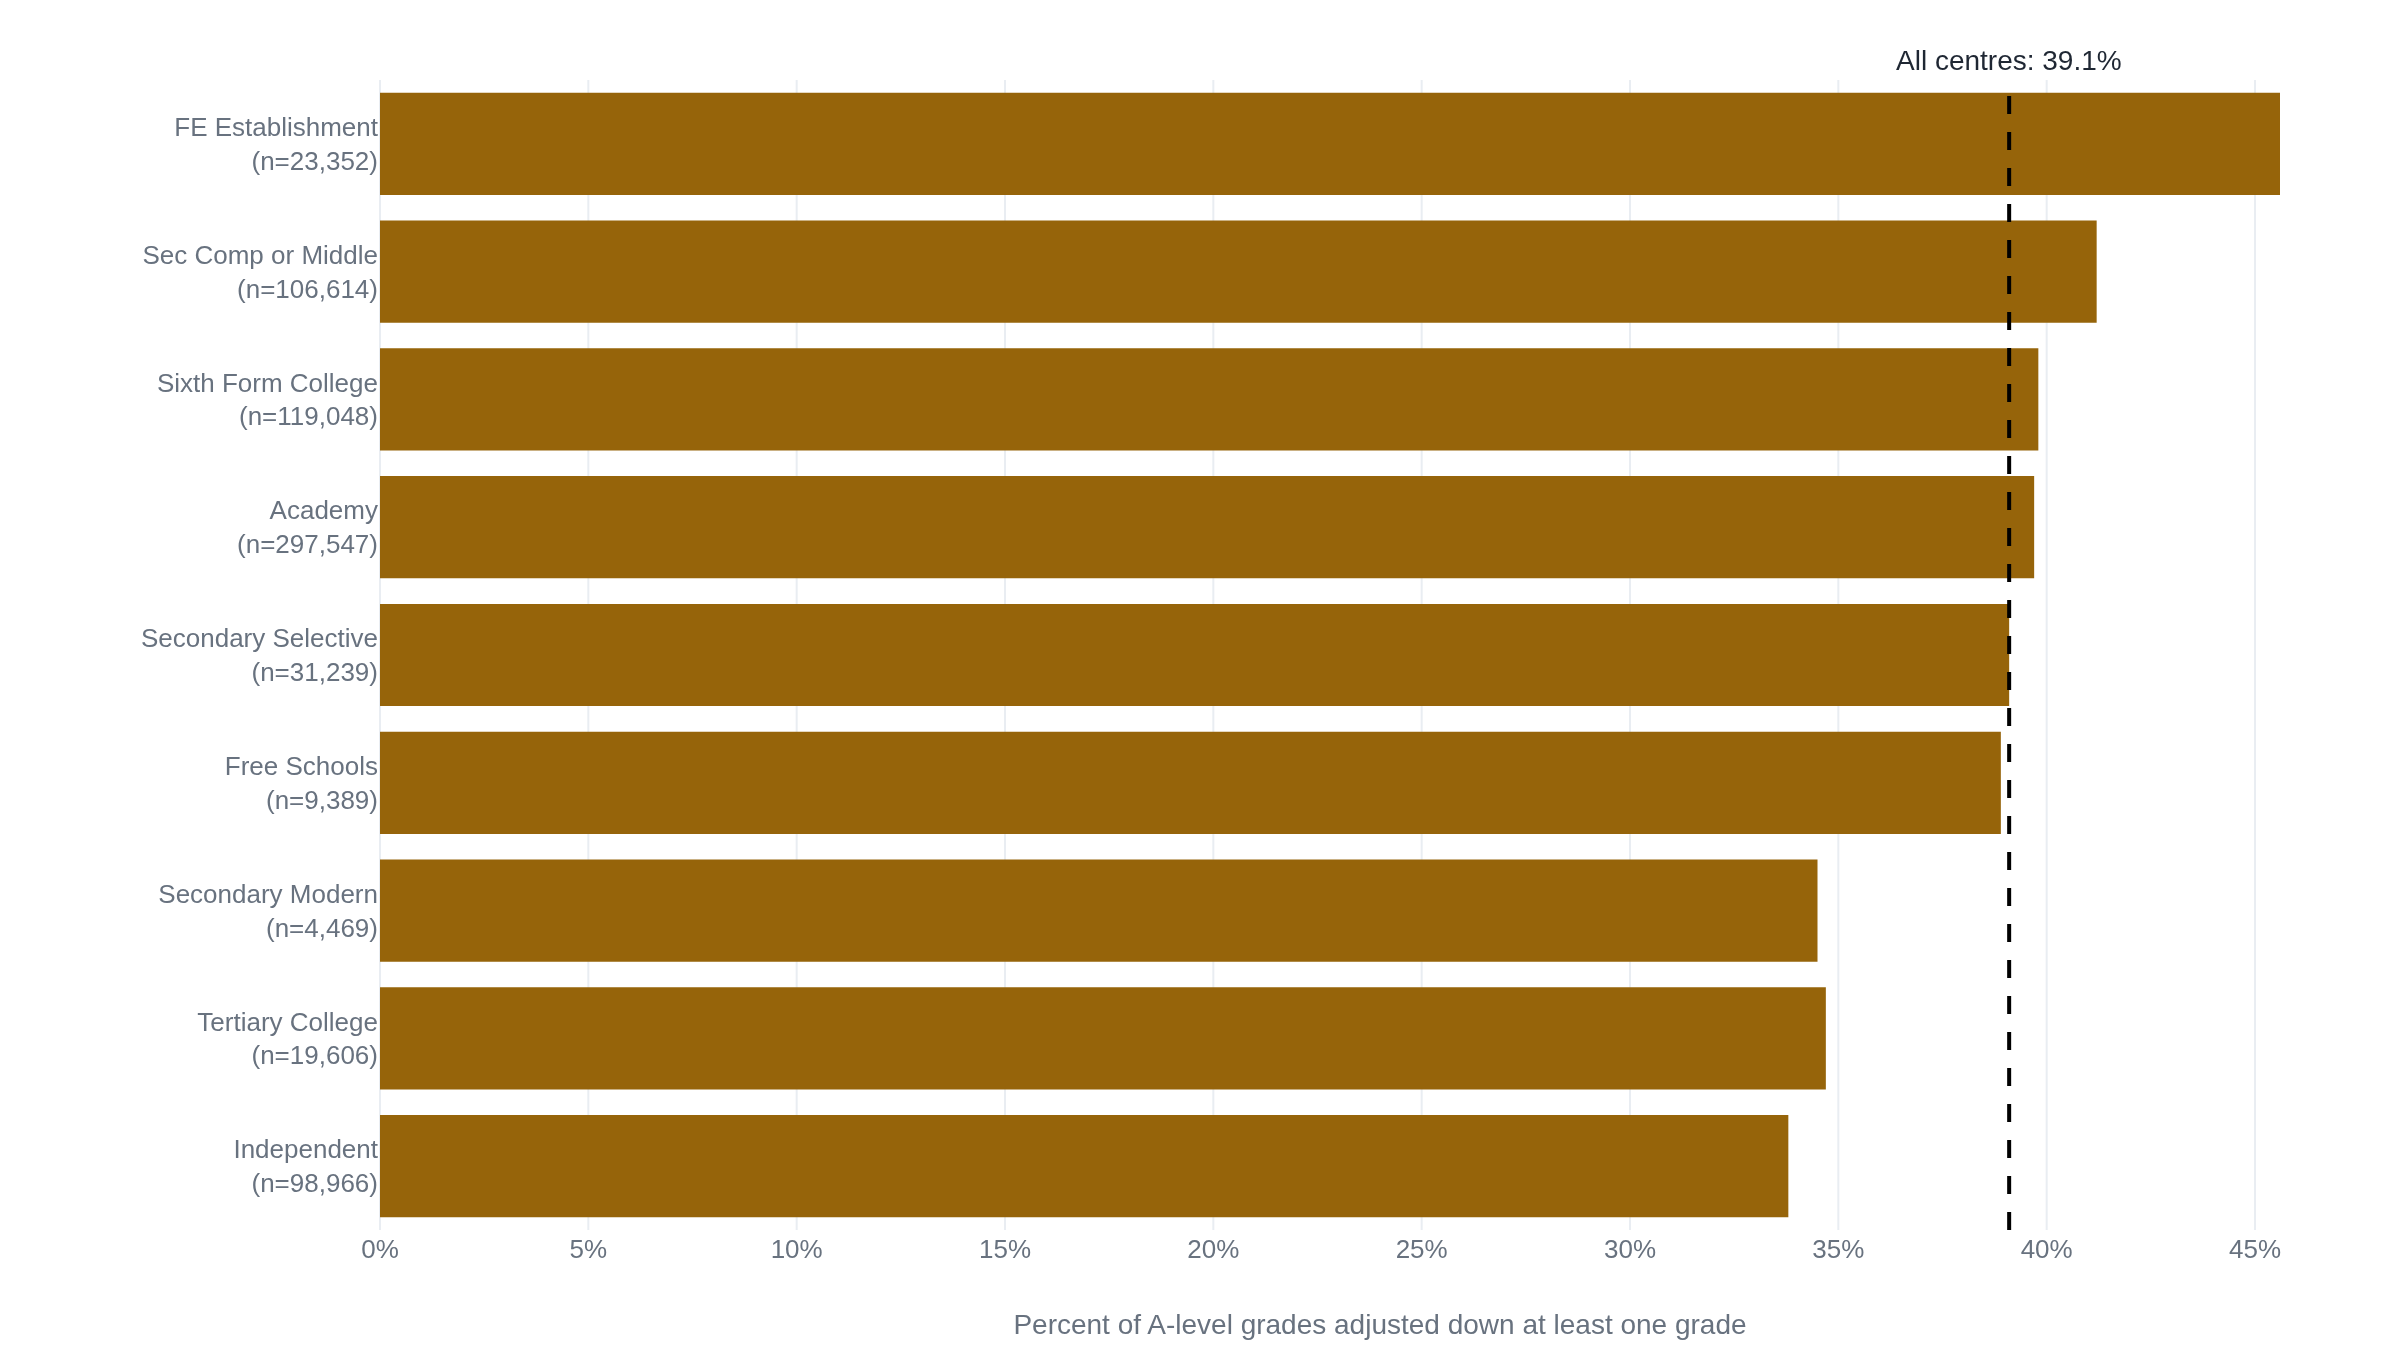
Ofqual points to class size for the explanation: independent schools, running smaller classes, more often qualified for a carve-out built into the model for small groups.3 A more granular Ofqual analysis, published in August 2021, tested that directly. Which school a student attended explained more than 30% of the variation in how far a grade moved, more than any demographic factor measured. Once centre was accounted for, socio-economic background, special-educational-needs status, and home language showed no association with the gap.4
Ofqual's original equalities analysis, published alongside the model, had concluded there was "no evidence that this year's process of awarding grades has introduced bias."1 Both findings can be true at once. The model never asked a student's ethnicity, income, or postcode, only which centre they sat their exam through, using that centre's history as the pattern to fit them to. A centre's history is not a demographic characteristic; it correlates with one without being identical to it, and the correlation alone reproduced the outcome the direct test found none for.
Students forced a U-turn
Students who felt the downgrade did not wait for a second analysis. Hundreds gathered outside the Department for Education, chanting "fuck the algorithm."5 On 14 and 15 August, others gathered outside Downing Street and at Speaker's Corner in Hyde Park. Ophelia Gregory, 18, an organiser, told reporters: "We want the government to use the centre assessed grades. Not only do we want that, we want them to do it quickly."6
On Monday 17 August, four days after results day, Ofqual and the Department for Education reversed course. Students would receive whichever was higher, the teacher's CAG or the calculated grade, which in practice meant the CAG.7 Ofqual's chair, Roger Taylor, put it plainly: "Seeing this we realised we had taken the wrong road here and we needed to change course," a process "causing anxiety for young people" and "putting an administrative burden on teachers."7
The reversal did not end accountability. On 25 August, Ofqual's chief regulator, Sally Collier, resigned; the NEU's Kevin Courtney said "someone had to take responsibility for the exams fiasco, but the issues run far deeper."8 The next day, the Department for Education's permanent secretary, Jonathan Slater, had his departure announced, months early, and Prime Minister Boris Johnson told pupils in Leicestershire: "I'm afraid your grades were almost derailed by a mutant algorithm."9 The officials who left ran Ofqual and exams policy. Williamson, the minister whose direction the model satisfied, did not.
Two disputes outlasted that week. The Royal Statistical Society said Ofqual's proposed confidentiality agreement for two advisory-group seats would have barred its statisticians from commenting on "the final choice of the model for some years"; Ofqual's chair denied it, saying the agreement covered only confidential material.1011 Both sides agree no nominated statistician sat on the panel before results day. Responsibility itself, Ofqual's design or the ministerial direction it satisfied, was for the House of Commons Education Committee to adjudicate. The Office for Statistics Regulation comes closest: across all four nations, "none of the models were able to command public confidence."12 Ofqual met the target it was given; the direction came from the minister who kept his job.
Opening the hood: how a rank became a grade
Everything so far is what happened. Here is how. The model ran in two stages, and the distinction between them is the whole mechanism.
Stage one set a target: what share of this year's students at a given school should get an A, a B, a C, and so on. That share came from how grades had behaved at that school in 2017, 2018, and 2019, adjusted for this cohort's prior attainment.1 Call this the centre's target: a shape, not a list of names. It says how many chemistry students at one college should get each grade this year, nothing about which student gets which one.
Stage two filled the target with people. Ofqual's report states the rule directly: students are "allocated to meet the centre level prediction for the subject as closely as possible," using "the rank order of students provided by the centre."1 If the target called for 20% A grades in a class of 30, the top six in the rank order received an A, whatever CAG the teacher had written for them.1
Follow one student through both stages, in a hypothetical class of 30 built from Ofqual's actual rule. Suppose the school's 2017-2019 history sets the target at six A grades. A student ranked seventh by her teacher, one place below the cutoff, gets a B. Nothing about her own exam produced that grade; she sat no exam. Her rank came from her teacher's ordering of her against 29 classmates. Her grade came from where the target line fell in her school's history. Move the same student, same rank, same teacher, into a school whose history supported eight A grades in a class that size, and she is an A student. The exam that never happened could not have told the two schools apart. Their historical records did: real information about one person, her rank, poured into a target built from a different year's students entirely.
Why five and fifteen decided whose grade was real
Ofqual knew stage one broke down for small classes. A grade distribution built from three or four students across three years is not a statistical pattern. It is a coincidence. So the model added a third input: class size, measured as the harmonic mean of this year's and the historical years' entries.1
Ofqual set two thresholds for that size, n_thresh and n_small, fixed at 5 and 15 students.1 Below five, the statistical target was dropped and every student got their original CAG. Between five and fifteen, the model blended the two, weighting the teacher more as the class got smaller. Above fifteen, the historical target ruled alone, and rank order only decided who landed where inside it.1
A class of four had a teacher's CAG and nothing else standing between a student and their grade. A class of two hundred had a rank order and nothing else deciding which grade, inside a shape the statistics had already fixed. Below the threshold, the model trusted the teacher completely, for lack of other evidence. Above it, it trusted the school's history completely, and rank order only moved a student sideways inside a total that history had already set.
Independent schools, with typically smaller classes, more often sat below fifteen, keeping more students on the CAG-favouring end of the taper. Ofqual's own analysis says as much: the centre-type gap above "is likely to reflect... the proportion of small cohorts within each centre type," not a different rule for different schools.3 Large comprehensives, academies, and further-education colleges, teaching most state-educated students in bigger classes, sat well above fifteen, where three years of history decided the shape their students were fitted into.
The takeaway
A calculated grade measured a school's history between 2017 and 2019, with the rank order used only to place a student inside that shape. The model never touched a student's background. It made every result depend on the centre's history instead, a variable background is unevenly sorted into: that is how it passed its own bias check and still handed out grades that tracked which kind of school a student attended. It is also why class size, not subject or region, decided whether a grade came from a teacher who knew the student or from three years of students who were not them. Five and fifteen were not a footnote. They were the line between being seen and being fitted. The same choice, a group's recorded past standing in for an individual's untested present, sits inside any system that scores a person by the history of its group: a loan priced by a postcode's default rate, a candidate ranked against a firm's past hires. Each of those systems runs on one trade-off. The group behind the score has to be large enough to make the fit meaningful, and small enough that the one person folded into it still counts as more than a data point. Results day got that trade-off backward.
- 01
- Ensuring statistical models command public confidence: the regulator's full review of all four UK nations' 2020 grading models.
- 02
- Grading gaps in summer 2020: who was affected?: Ofqual's own 2021 dig into which students saw the largest gaps.
Sources
- Ofqual · Awarding GCSE, AS, A level, Advanced Extension Award and Extended Project Qualifications in summer 2020: interim report (11 August 2020)
- Ofqual · A level results 2020 (Ofqual/20/6655, 13 August 2020)
- Ofqual · Summer 2020 results analysis: GCSE, AS and A level (17 December 2020)
- Ofqual · Grading gaps in summer 2020: who was affected by differences between centre assessment grades and calculated grades (2 August 2021)
- Daan Kolkman · "'F**k the algorithm?': what the world can learn from the UK's A-level grading fiasco," LSE Impact of Social Sciences blog (26 August 2020)
- Press Association · A-level results: Students protest at Government handling (August 2020)
- ITV News · Government U-turn over A Level results (17 August 2020)
- Edexec · Ofqual chief Sally Collier resigns (August 2020)
- Press Association (Alloa Advertiser) · Johnson blames exam fiasco on "mutant algorithm" (26 August 2020)
- Royal Statistical Society (Deborah Ashby, Sharon Witherspoon) · Letter to Ed Humpherson, Office for Statistics Regulation (14 August 2020)
- Roger Taylor (Ofqual Chair) · Letter to Professor Deborah Ashby and Sharon Witherspoon, RSS (21 August 2020)
- Office for Statistics Regulation · Ensuring statistical models command public confidence: Learning lessons from the approach to developing models for awarding grades in the UK in 2020 (2 March 2021)